CrampGuard Case Study
Predictive cramp prevention. Designed for stava + Apple Watch
Project Details
Role: Senior Product Designer (Concept Project)
Platforms: Strava + Apple Watch
Industry: Health & Fitness Tech
Scope: Feature Design · UX Strategy · Data Architecture · AI-Assisted Production
Status: Concept - not affiliated with Strava or Apple
The Problem
During a Hyrox event, I cramped at the 500m mark of the run between stations 6 and 7. Post-event, the data told a clear story: heart rate trending 8–11 bpm above equivalent training efforts since station 4, estimated sweat loss around 1.2kg above what I'd replaced, pace running 14% faster than comparable training efforts. All three signals were present on my wrist the entire time. None of them were surfaced.
No mainstream fitness platform currently provides real-time or predictive cramp risk alerts. Strava offers post-activity analysis only. Garmin flags some dehydration on newer devices. Apple Fitness+ tracks heart rate zones. WHOOP monitors recovery and strain. None of them tell you what's coming.
| Platform | Cramp Prevention Capability |
|---|---|
| Strava | Post-activity analysis only. No real-time alerts. No cramp-specific modelling. |
| Garmin Connect | Some dehydration flags on newer devices. No cramp risk score. |
| Apple Fitness+ | Heart rate zones during workout. No fatigue accumulation or sweat modelling. |
| WHOOP | Strong recovery and strain tracking. No in-workout cramping alerts. |
The Science
Heart rate drift, pace deviation from baseline, and estimated sweat loss — all available from an Apple Watch and Strava activity — contain sufficient signal to predict cramp risk 8–15 minutes before onset.
Exercise-associated muscle cramps are driven by two overlapping mechanisms:
Neuromuscular fatigue, where sustained high-intensity effort disrupts the inhibitory signals that keep muscles from firing uncontrollably.
Electrolyte depletion, where sweat-driven losses of sodium, potassium, and magnesium disrupt the ion gradients required for normal contraction.
Most sports scientists accept both mechanisms are valid, and in practice, both are usually present simultaneously.
The good news is that both leave measurable signals well before a cramp occurs.
| Signal | Mechanism | Data Availability |
|---|---|---|
| Heart Rate Drift | Cardiovascular strain, dehydration-mediated plasma volume reduction | High — continuous via Apple Watch |
| Pace vs. Training Baseline | Neuromuscular overload from exceeding trained capacity | High — GPS from Apple Watch / Strava |
| Estimated Sweat Loss | Electrolyte depletion proxy — sodium, potassium, magnesium | Medium — modelled from effort + conditions |
| Cumulative Load Score | Multi-discipline fatigue accumulation across Hyrox stations | High — calculable from prior station data |
| Environmental Heat Index | Amplifies both neuromuscular fatigue and electrolyte loss rates | Medium — weather API + GPS location |
| Prior Cramp History | Strongest individual predictor — Strava activity history | Very High — existing Strava data |
Data Architecture
The Cramp Risk Index (CRI) is a rolling composite score computed every 60 seconds during activity. It combines five signals into a single number from 0 to 100.
CRI = (0.30 × HRD) + (0.25 × PES) + (0.20 × SLE) + (0.15 × CLS) + (0.10 × PCF)
HRD — Heart Rate Drift: current HR vs. expected HR at current pace PES — Pace Excess Score: current pace as % above 60-day threshold
SLE — Sweat Load Estimate: modelled cumulative fluid loss vs. intake
CLS — Cumulative Load Score: prior station effort converted to run fatigue units
PCF — Prior Cramp Flag: multiplier 1.0 (no history) or 1.25 (prior cramps logged)
🟢 Green — CRI below 40 · Advisory only
🟡 Amber — CRI 40–65 · Ease pace, consider hydrating
🔴 Red — CRI above 65 · Act immediately
Design Principles
1. Minimal Distraction — Glanceable. One-line instruction. Communicates status without competing with the activity itself.
2. Graduated Escalation — Green / Amber / Red. The interface speaks risk before the athlete has to think about it.
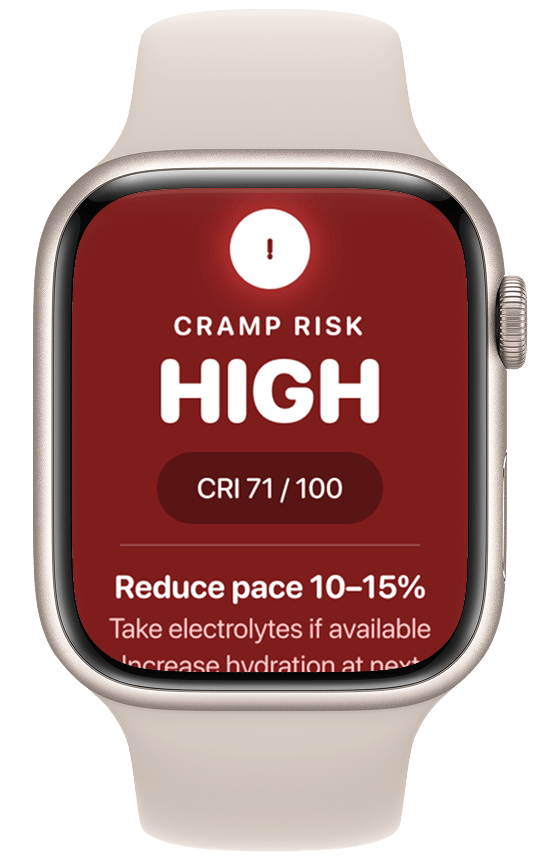
3. Actionable Specificity — Every alert carries a specific recommended action. Not "cramp risk detected" — "reduce pace 10–15% and take electrolytes now."
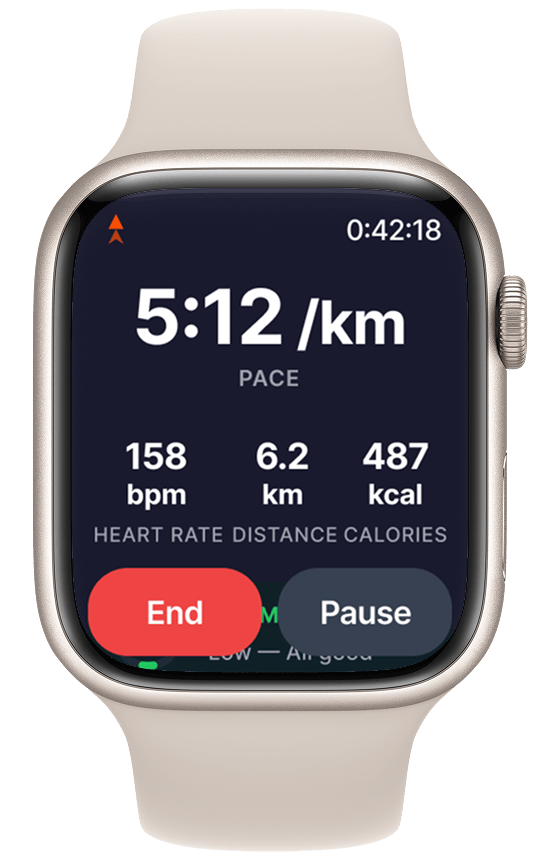
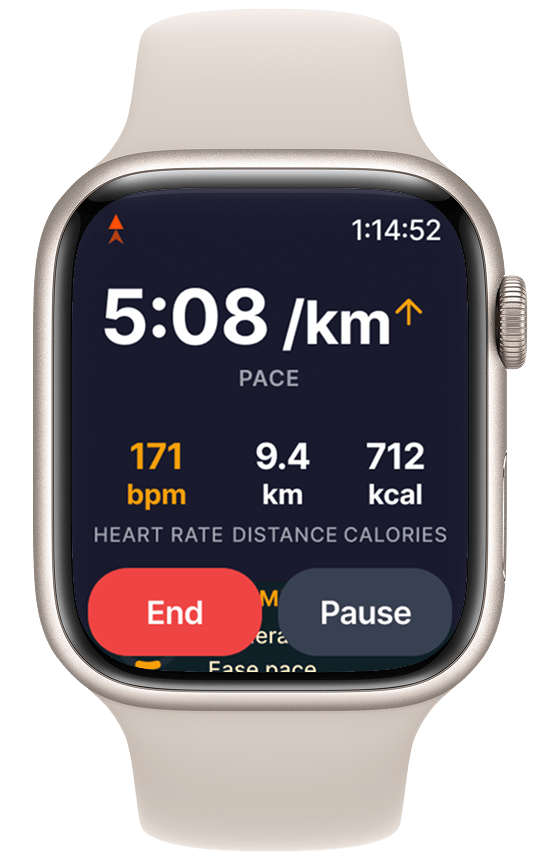
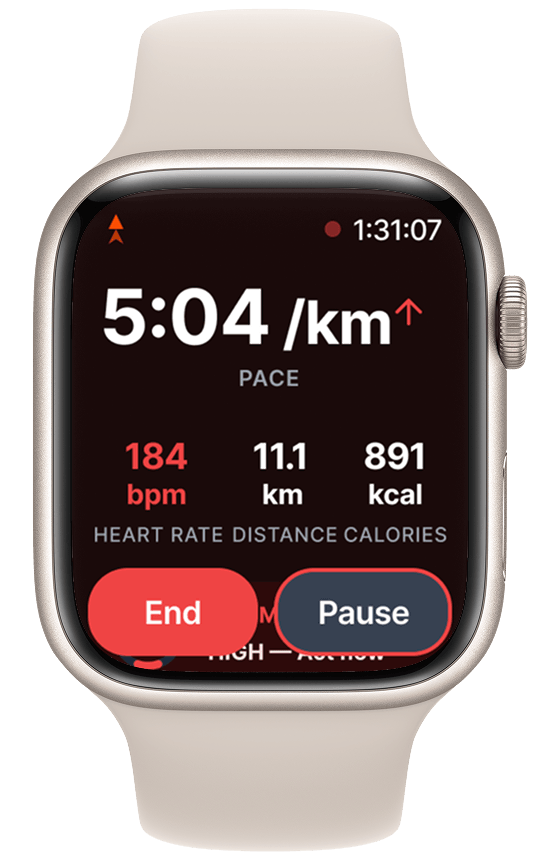
Apple Watch Screens
Strava Mobile · Live Tracking
The three live tracking states sit side by side — the only thing changing between them is the CrampGuard status strip and alert card. Green is ambient. Amber introduces an advisory card. Red takes over the lower half of the screen with a priority instruction.
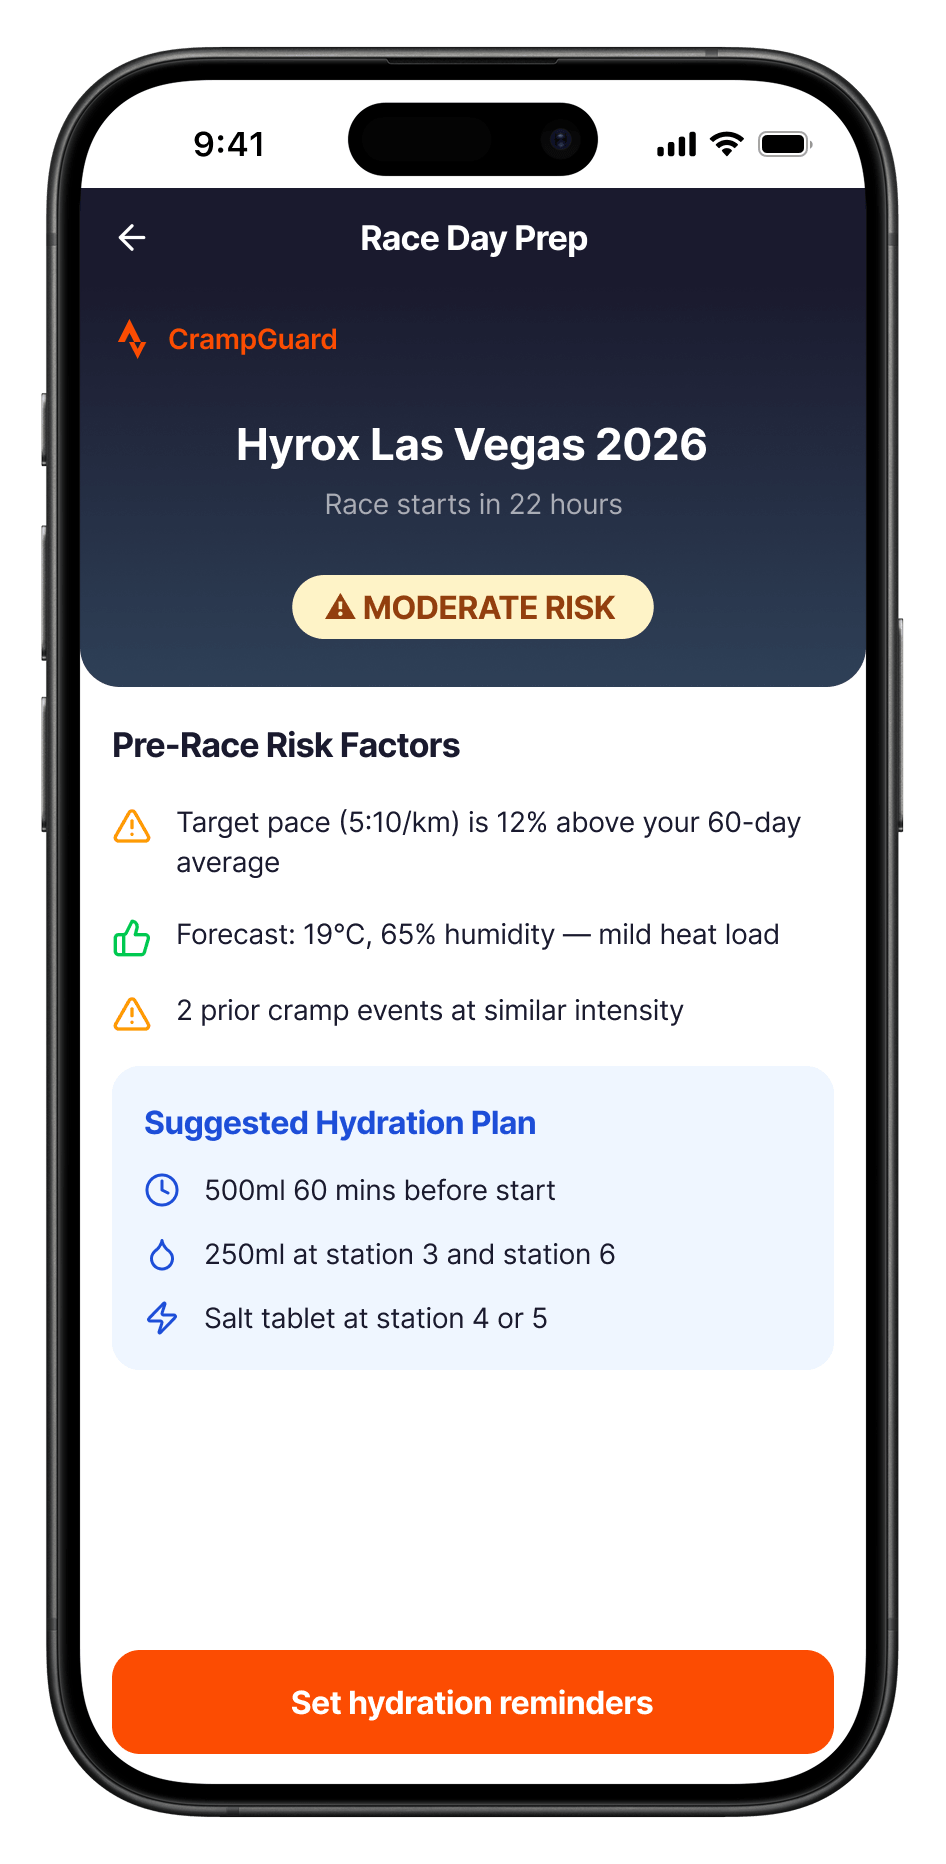
Strava Mobile · Analysis + Pre-Race
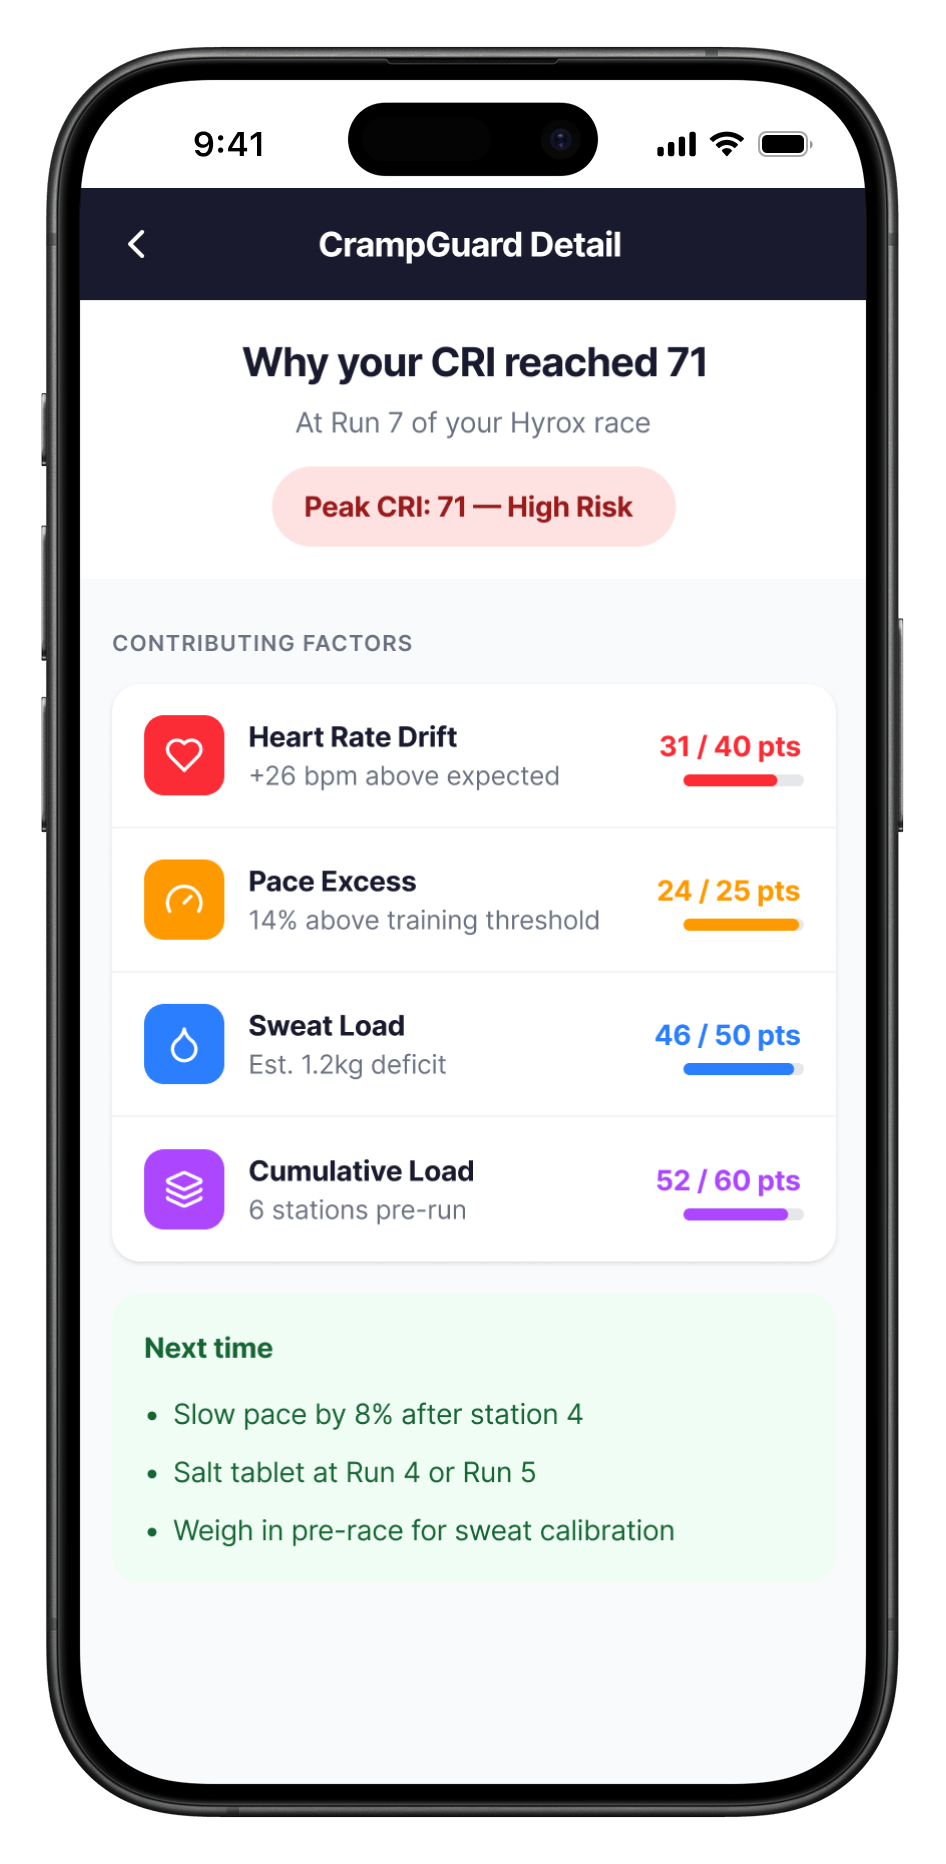
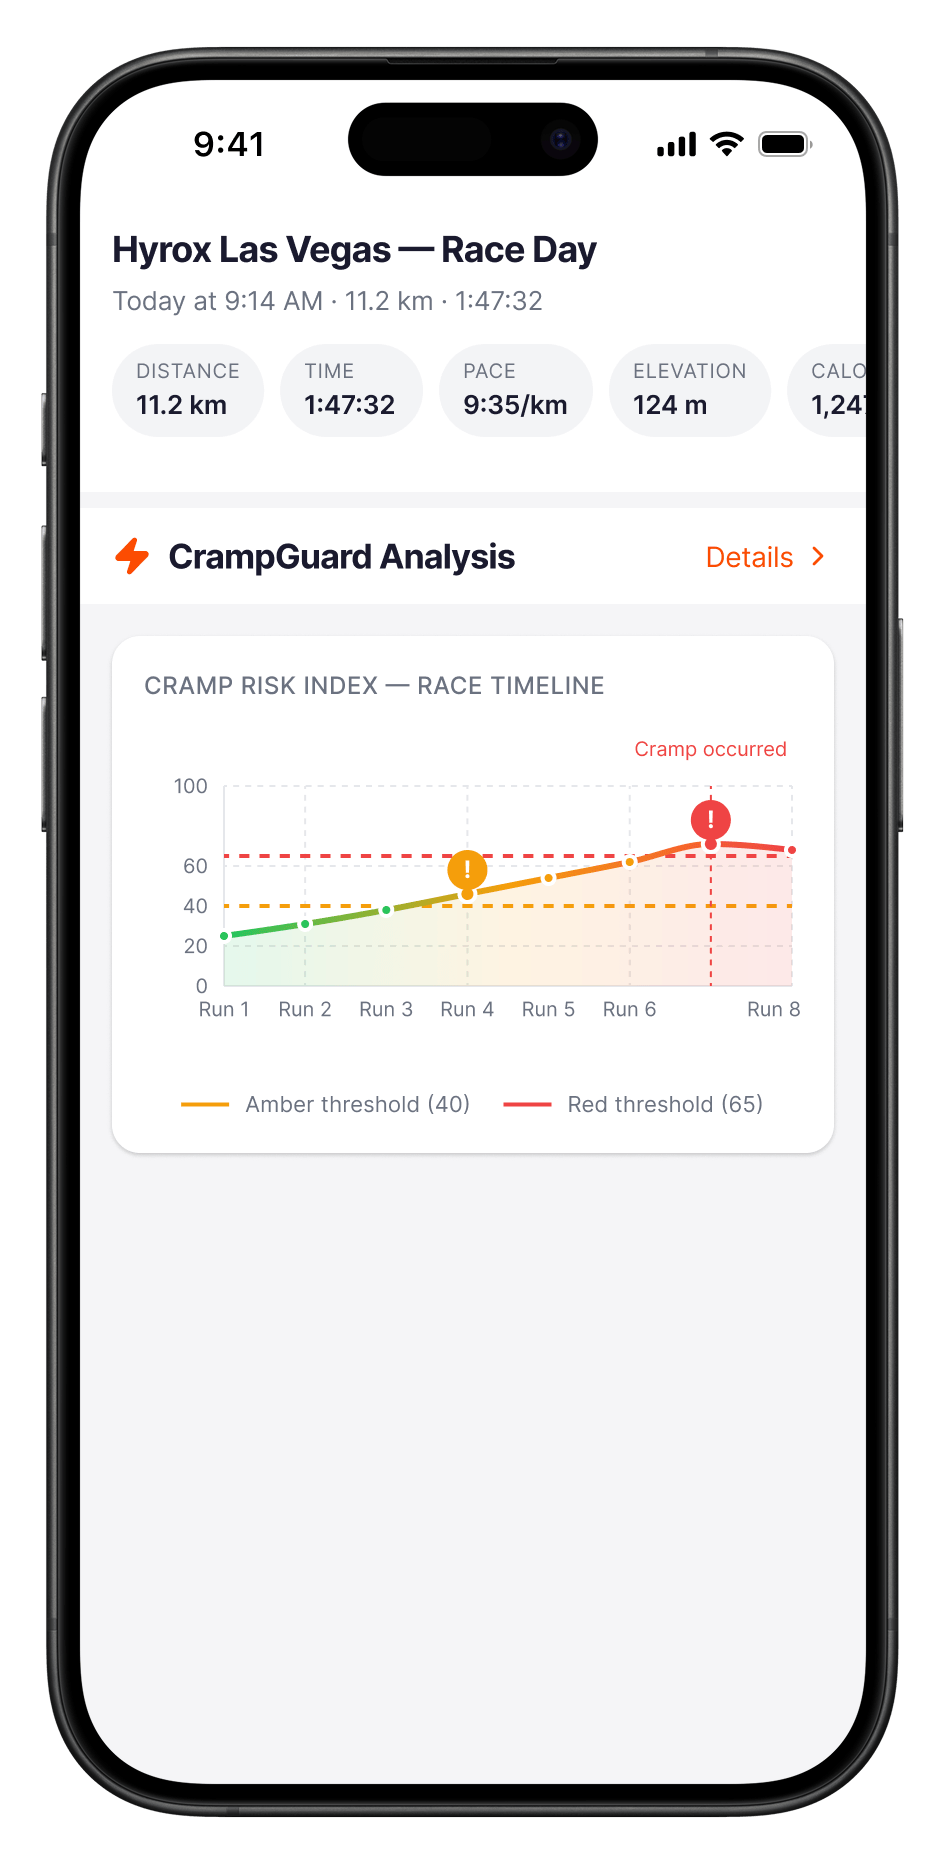
Post-race, the CRI trace is surfaced directly on the activity detail page alongside pace and heart rate. The factor breakdown shows exactly which signals drove the peak — heart rate drift, pace excess, sweat load, cumulative station fatigue. The pre-race summary fires 24 hours before a logged race with a personalised risk assessment and hydration plan.
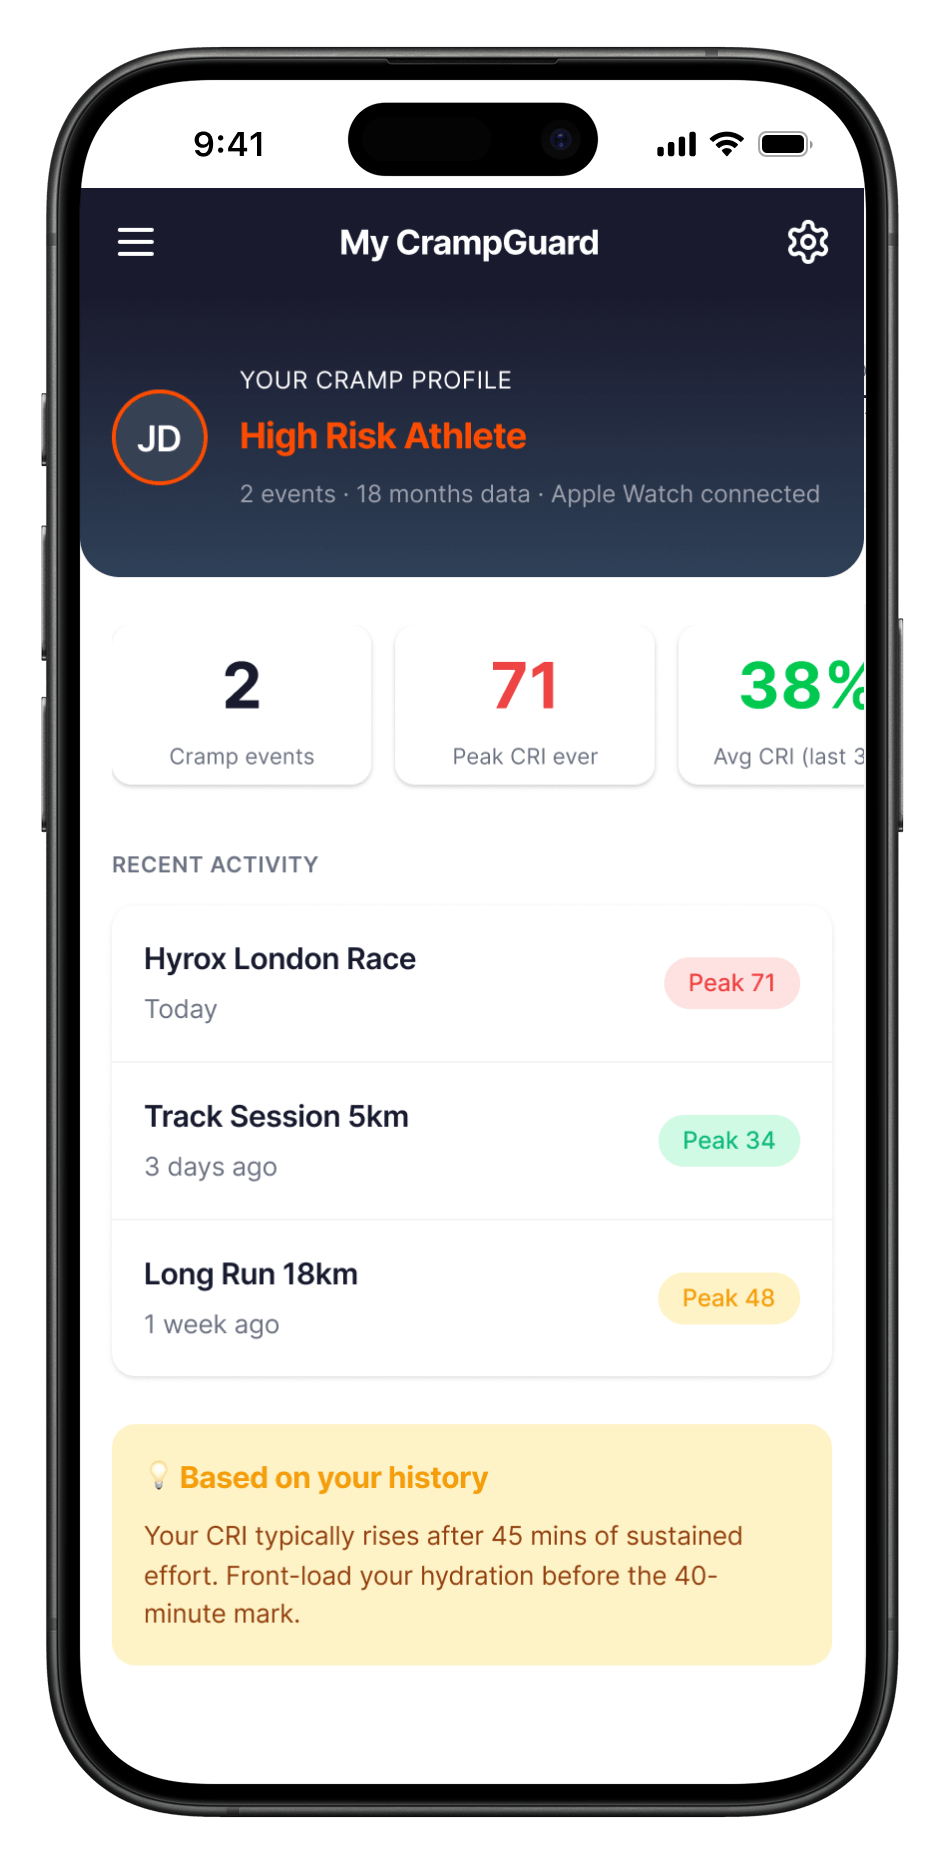
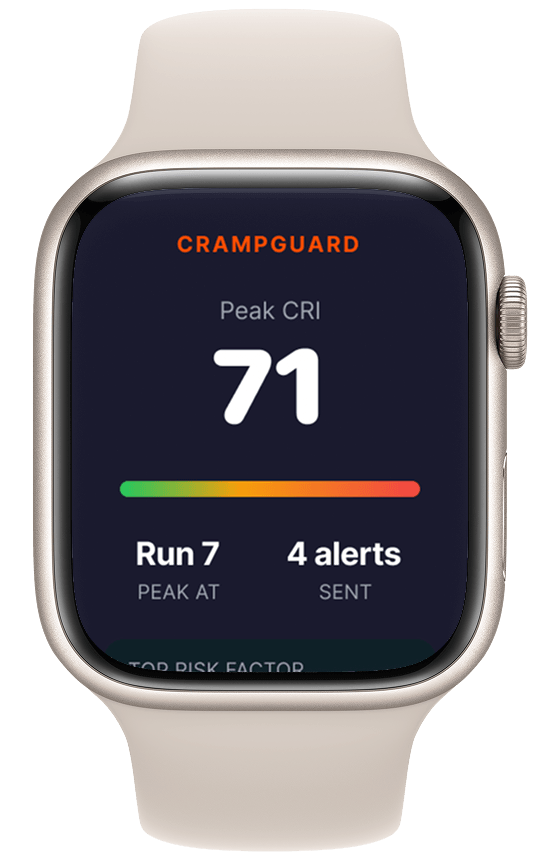
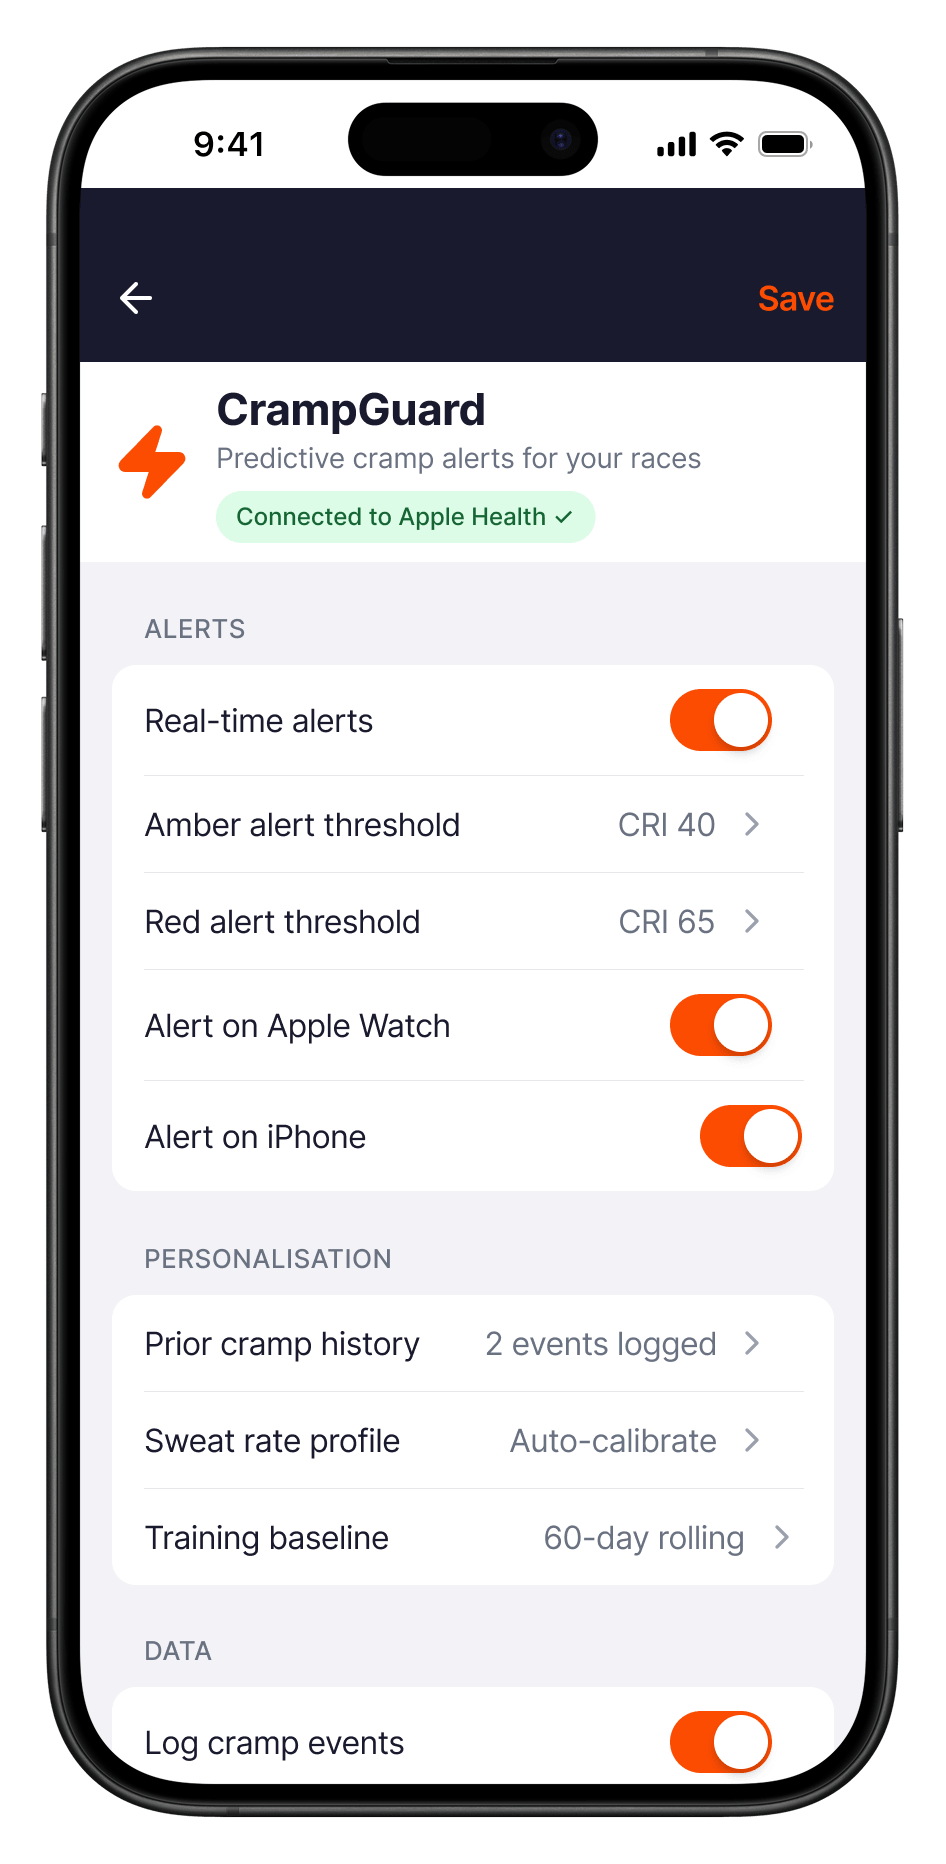
Strava Mobile · Settings + Dashboard
Settings surface the full alert configuration, threshold tuning, Apple Watch toggle, sweat rate calibration, cramp event logging. The athlete dashboard aggregates personal cramp history, peak CRI over time, and a rolling 30-day average.
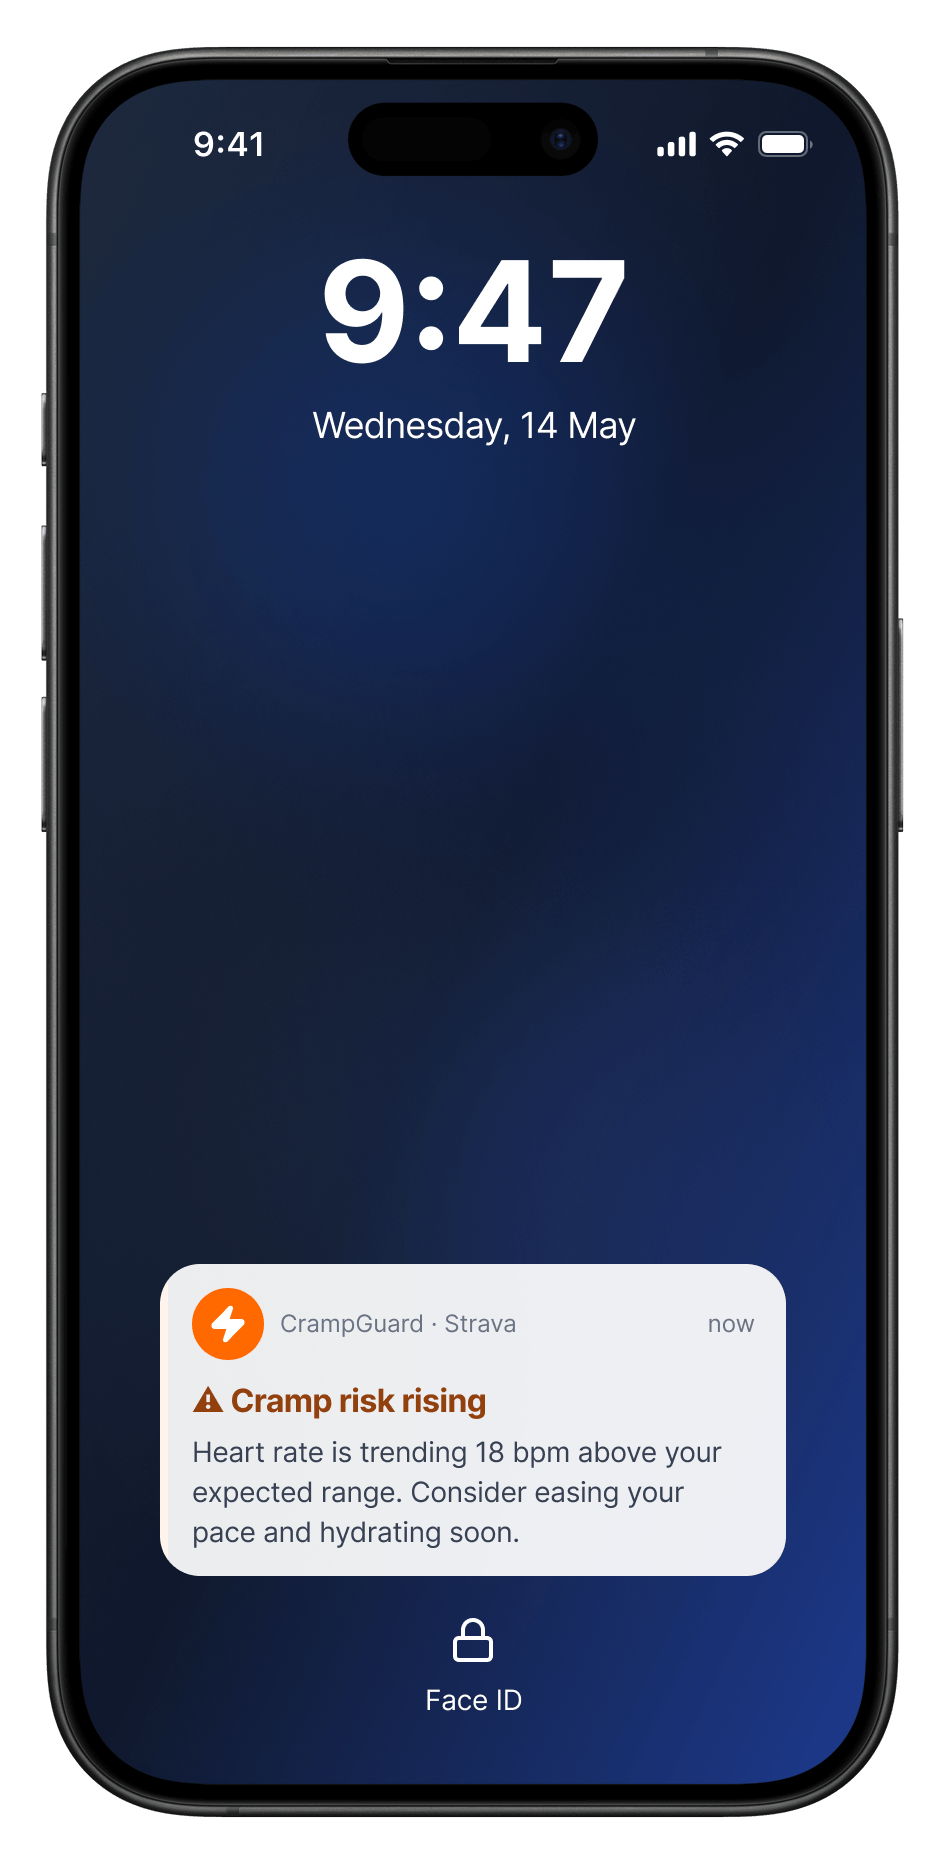
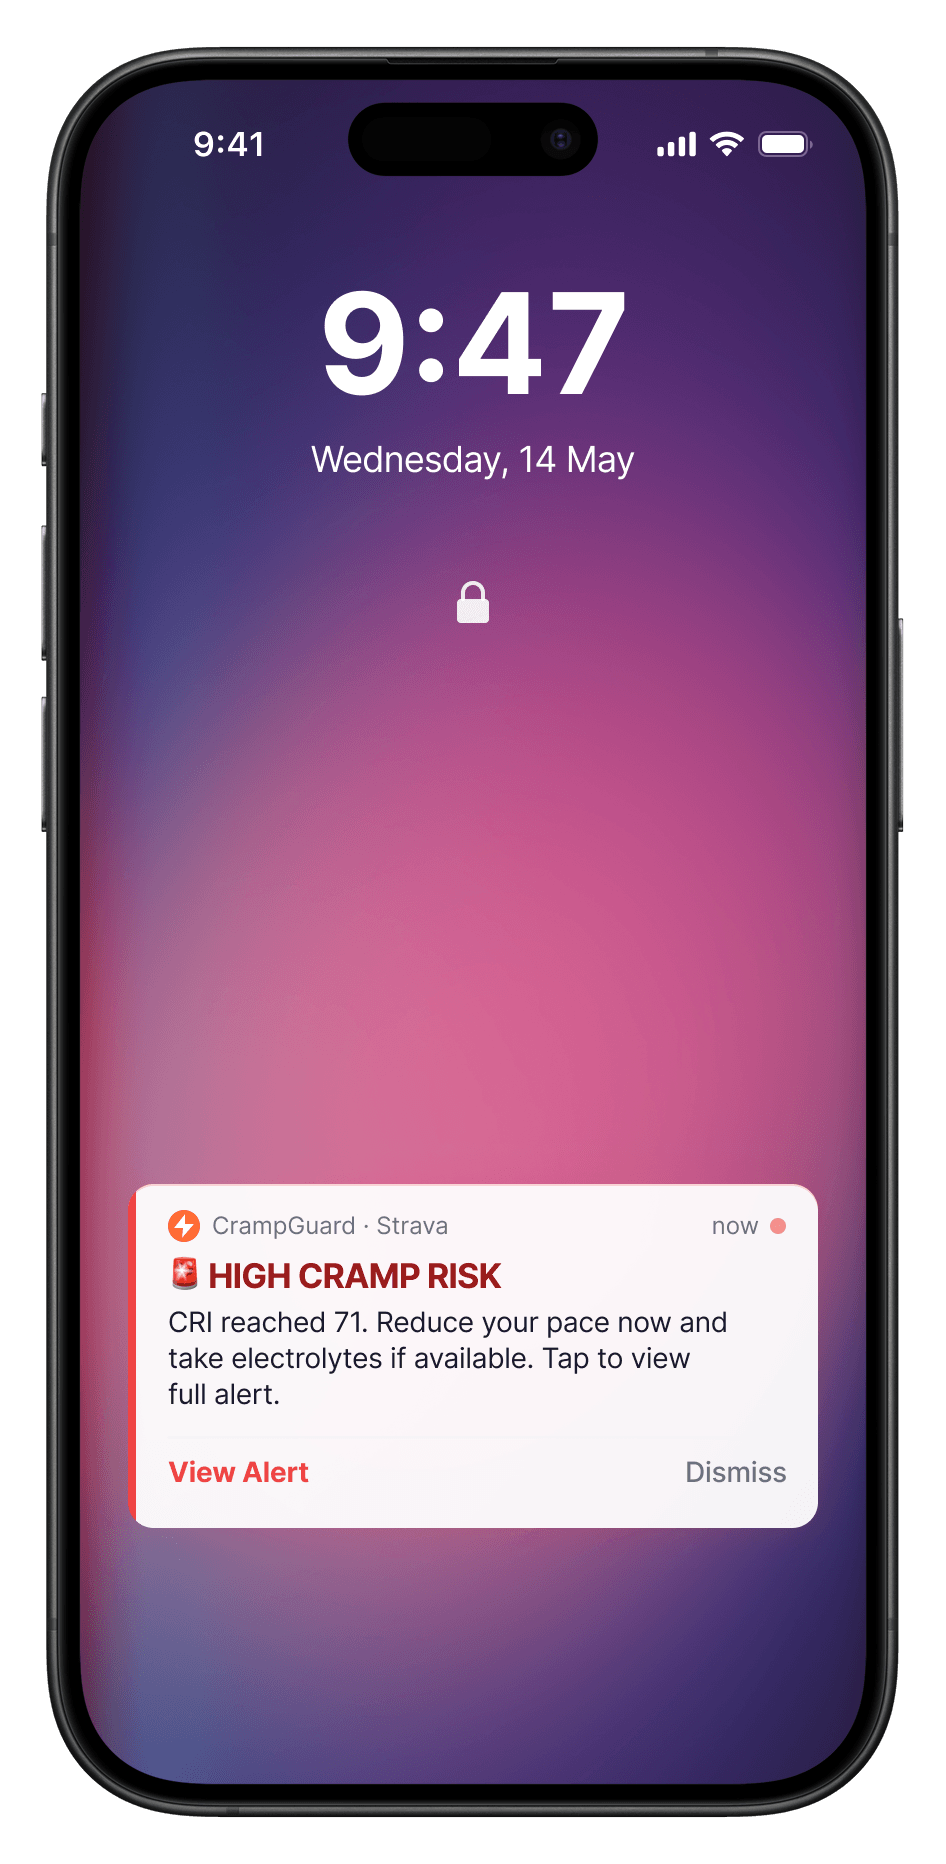
iOS Notifications
Alerts are delivered to the lock screen with graduated urgency. Amber is advisory, a gentle heads up with no action required. Red demands acknowledgment, it fires simultaneously on the Apple Watch as a full-screen takeover and on the iPhone lock screen with explicit action options.
The Race Scenario
To test the UX logic, a synthetic race scenario was constructed, Hyrox Las Vegas 2026, male athlete, 34, 78kg, 18 months of Strava training history, two prior cramp events on record. The data is synthetic, constructed to be physiologically realistic and internally consistent. It is not a real activity export.
The table below shows the CRI computed at the start of each run segment across the race:
| Segment | CRI Score | Status |
|---|---|---|
| Run 1 | 25 | Low Risk |
| Run 2 | 31 | Low Risk |
| Run 3 | 38 | Low Risk |
| Run 4 | 46 | ⚠ Amber Alert Triggered |
| Run 5 | 54 | Moderate |
| Run 6 | 62 | ⚠ Second Amber Alert |
| Run 7 | 71 | 🔴 Red Alert — Cramp Occurred |
Had the athlete responded to the Run 4 amber alert by reducing pace by 8% and taking a salt tablet, modelling suggests the CRI at Run 7 would have reached approximately 51, amber range, keeping it below the cramp threshold entirely.
Technical Feasibility
Already Exists Today
- Strava–Apple HealthKit integration
- Strava API — activity history, Relative Effort
- Apple HealthKit workout session streaming
- Strava live activity tracking on iOS
Needs to Be Built
- CRI computation engine (on-device Swift)
- Baseline calibration model
- Alert delivery layer — Watch + iOS
- Post-activity CRI analytics view
- Pre-race risk summary + weather API
- Cramp feedback logging
Roadmap
| Phase | Timeline | Scope |
|---|---|---|
| Phase 1 — MVP | Months 1–3 | Post-activity CRI trace on activity page. Cramp logging prompt. Data validation with real users. |
| Phase 2 — Real-Time | Months 4–6 | Live Apple Watch alerts. Amber and red thresholds active. Baseline calibration from Strava history. Running only. |
| Phase 3 — Multi-Sport | Months 7–10 | Hyrox and triathlon cumulative load model. Pre-race risk summary. Weather API integration. Hydration recommendations. |
| Phase 4 — Learning | Months 11–18 | Per-athlete model recalibration from cramp feedback. Android and Garmin via Health Connect. Optional partner integrations. |
In Closing
CrampGuard started as a personal frustration, the data was there, the platform wasn't doing anything with it. This project is an exercise in systems thinking:
Taking biometric signals that already exist, designing the logic layer that makes them useful, and building a UI that delivers the right information at the right moment without getting in the way.
It's also a demonstration of AI-fluent design practice: using Claude for structured thinking and documentation, and Figma Make for rapid UI exploration. The tools accelerated the work. The thinking behind it is entirely human.
Project Notes
This is a concept project. CrampGuard is not a real product and is not affiliated with Strava, Apple, or any third party. Race data used in the scenario is synthetic, constructed to be realistic, not exported from a real activity. The Cramp Risk Index model is conceptual and has not been clinically validated. This project is a performance aid concept, not a medical device.
AI tools used:
Claude (Anthropic) for case study writing, structuring, and documentation.
Figma Make for UI screen generation from written prompts.
Full transparency statement available on request.
References
Schwellnus, M.P. (2009). BJSM 43(6), 401–408.
Minetto, M.A. et al. (2013). Exercise and Sport Sciences Reviews, 41(1), 3–10.
Miller, K.C. et al. (2010). Sports Health, 2(4), 279–283.
Apple HealthKit Developer Documentation — developer.apple.com/documentation/healthkit
Strava API Documentation — developers.strava.com